
Page 14 - MWC 3-10-2022s
P. 14
THE CONTRIBUTION erated heifer placements into The Midwest Cattleman · March 10, 2022 · P14
continued from page 3 feedlots or have producers
been trying to capture short-
pectations of supply shortages term profits from stronger fed
and higher beef prices has in- and feeder cattle prices? One
creased beef demand. Higher way to look at this is to exam-
consumer demand is passed ine the heifer placement rates
down the beef complex through by the severity of the drought
prices. One impact of this de- that region experienced. Table
mand shift has been atypically 1 shows the total percent of
high prices for cull cows during cattle on feed that are heifers
the third and fourth quarters. and the severity of drought by
Seasonally this is when many state (D3 + D4 drought status).
cows enter the market from There does not appear to be
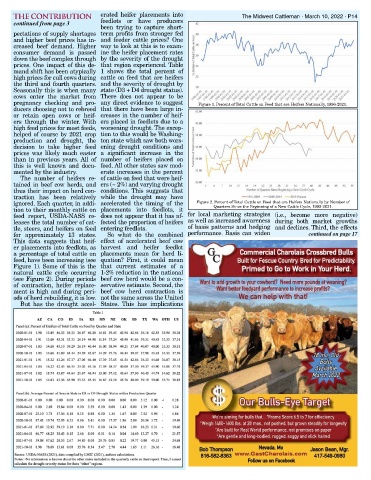
pregnancy checking and pro- any direct evidence to suggest Figure 1. Percent of Total Cattle on Feed that are Heifers Nationally, 1996-2021.
ducers choosing not to rebreed that there have been large in-
or retain open cows or heif- creases in the number of heif-
ers through the winter. With ers placed in feedlots due to a
high feed prices for most feeds, worsening drought. The excep-
helped of course by 2021 crop tion to this would be Washing-
production and drought, the ton state which saw both wors-
decision to take higher feed ening drought conditions and
prices was likely much easier a significant increase in the
than in previous years. All of number of heifers placed on
this is well known and docu- feed. All other states saw mod-
mented by the industry. erate increases in the percent
The number of heifers re- of cattle on feed that were heif-
tained in beef cow herds, and ers (~ 2%) and varying drought
thus their impact on herd con- conditions. This suggests that
traction has been relatively while the drought may have
ignored. Each quarter, in addi- accelerated the timing of the Figure 2. Percent of Total Cattle on Feed that are Heifers Nationally by Number of
tion to their monthly cattle on placements into feedlots, it Quarters Since the Beginning of a New Cattle Cycle, 1992-2021.
feed report, USDA-NASS re- does not appear that it has af- for local marketing strategies (i.e., become more negative)
leases the total number of cat- fected the proportion of heifers as well as increased awareness during both market growths
tle, steers, and heifers on feed entering feedlots. of basis patterns and hedging and declines. Third, the effects
for approximately 13 states. So what do the combined performance. Basis can widen continued on page 17
This data suggests that heif- effect of accelerated beef cow
er placements into feedlots, as harvest and heifer feedlot
a percentage of total cattle on placements mean for herd li-
feed, have been increasing (see quation? First, it could mean
Figure 1). Some of this is the that current estimates of a
natural cattle cycle occurring 1-2% reduction in the national
(see Figure 2). During periods beef cow herd would be a con-
of contraction, heifer replace- servative estimate. Second, the
ment is high and during peri- beef cow herd contraction is
ods of herd rebuilding, it is low. not the same across the United
But has the drought accel- States. This has implications