
Page 6 - MWC 08-5-2021s
P. 6
The Midwest Cattleman · August 5, 2021 · P6
USDA Reports Show Reduced Cattle Numbers Now and Later
By Derrell Peel - Oklahoma State University
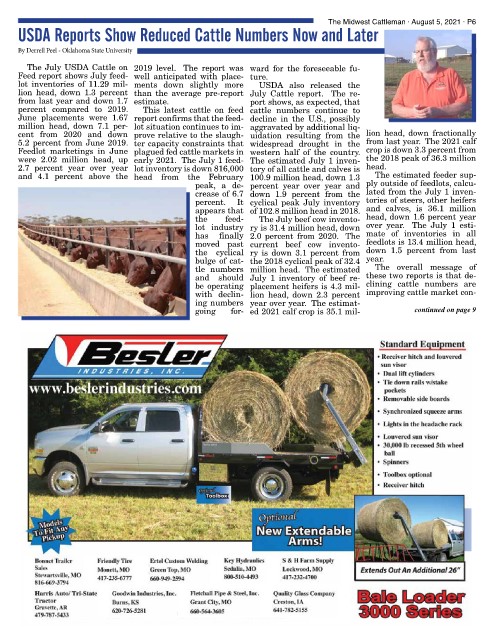
The July USDA Cattle on 2019 level. The report was ward for the foreseeable fu-
Feed report shows July feed- well anticipated with place- ture.
lot inventories of 11.29 mil- ments down slightly more USDA also released the
lion head, down 1.3 percent than the average pre-report July Cattle report. The re-
from last year and down 1.7 estimate. port shows, as expected, that
percent compared to 2019. This latest cattle on feed cattle numbers continue to
June placements were 1.67 report confirms that the feed- decline in the U.S., possibly
million head, down 7.1 per- lot situation continues to im- aggravated by additional liq-
cent from 2020 and down prove relative to the slaugh- uidation resulting from the lion head, down fractionally
5.2 percent from June 2019. ter capacity constraints that widespread drought in the from last year. The 2021 calf
Feedlot marketings in June plagued fed cattle markets in western half of the country. crop is down 3.3 percent from
were 2.02 million head, up early 2021. The July 1 feed- The estimated July 1 inven- the 2018 peak of 36.3 million
2.7 percent year over year lot inventory is down 816,000 tory of all cattle and calves is head.
and 4.1 percent above the head from the February 100.9 million head, down 1.3 The estimated feeder sup-
peak, a de- percent year over year and ply outside of feedlots, calcu-
crease of 6.7 down 1.9 percent from the lated from the July 1 inven-
percent. It cyclical peak July inventory tories of steers, other heifers
appears that of 102.8 million head in 2018. and calves, is 36.1 million
the feed- The July beef cow invento- head, down 1.6 percent year
lot industry ry is 31.4 million head, down over year. The July 1 esti-
has finally 2.0 percent from 2020. The mate of inventories in all
moved past current beef cow invento- feedlots is 13.4 million head,
the cyclical ry is down 3.1 percent from down 1.5 percent from last
bulge of cat- the 2018 cyclical peak of 32.4 year.
tle numbers million head. The estimated The overall message of
and should July 1 inventory of beef re- these two reports is that de-
be operating placement heifers is 4.3 mil- clining cattle numbers are
with declin- lion head, down 2.3 percent improving cattle market con-
ing numbers year over year. The estimat-
going for- ed 2021 calf crop is 35.1 mil- continued on page 9